
Insights · Operations
Use It or Lose It: Why Budgets Reward the Wrong Projects
One plan, one way of measuring, and one scoreboard everyone reads the same way, from the owner's quarter to one person's Tuesday.

Every fall, a manager somewhere is hunting for ways to spend what's left of this year's budget. Not because the business needs it, but because money left over gets cut next year. Multiply that by every department and you get a company that funds activity instead of outcomes.
The fix isn't a tighter budget. It's one plan, one way of measuring, and one scoreboard that everyone from the owner to the front line reads the same way. Here's why the usual approach breaks, and how to build one that holds.
Does use it or lose it budgeting really waste money?
Yes, and the clearest proof comes from the US federal government, because it publishes every contract. Economists Jeffrey Liebman and Neale Mahoney studied 14.6 million federal contracts from 2004 to 2009 and found that 8.7% of all spending happened in the last week of the fiscal year, nearly five times a normal week (NBER).
The rush wasn't harmless. Information technology projects bought in that final week were 2.2 to 5.6 times more likely to earn a lower quality rating (NBER working paper). Private companies rarely publish data like this, but the incentive is identical. When unspent money disappears, people spend it.
Why don't departments pull in the same direction?
Because most companies are aligned up and down, and broken side to side. Donald Sull, Rebecca Homkes and Charles Sull surveyed nearly 8,000 managers in more than 250 companies for Harvard Business Review. Most managers trust their own chain of command. Very few trust the department next door.
| What the research found | Number | Source |
|---|---|---|
| Federal spending in the last week of the fiscal year | 8.7%, nearly 5 times a normal week | NBER |
| Odds a last week IT project rates lower quality | 2.2 to 5.6 times higher | NBER |
| Managers who can rely on their boss and direct reports | 84% | Sull, Homkes and Sull |
| Managers who can always rely on other departments | 9% | Sull, Homkes and Sull |
| Missed commitments caused by other units versus their own team | 3 times more often other units | Business of Government |
| Middle managers who can name even one of five company priorities | 55% | Becker's |
| Past performance rewarded over collaboration | 2 to 3 times more often | Becker's |
That last row explains the rest. If collaboration isn't rewarded, people protect their own budget and their own number. Customer facing projects suffer most, because they always cross departments: sales, operations, support and finance each own a slice, and nobody owns the customer.
When I saw it up close
An agency I worked with needed six to eight months or more before a new client saw a single report. The people were working hard. The problem was that every client, team and department named its databases, tables and fields differently, so every project started from zero. We built a data accelerator: ready models such as customer lifetime value and churn, mapped to the same fields by industry. Reporting started within weeks, and it helped win new business. When no two teams measure the same way, nobody can compare anything.
How do you build a plan everyone marches to?
Start with a few company goals, tie every funded project to one of them, and measure every project the same way at every level. In practice that comes down to six moves.
- Pick three to five goals for the year. If only 55% of middle managers can name one of five priorities, fewer goals repeated often beat a long list.
- Fund cross department work as one project. One owner, one budget, one scorecard, so the 9% problem has nowhere to hide.
- Score every project the same way. Return on investment, dollars spent, customer impact and how well the team delivered with other departments. Same definitions everywhere.
- Build one dashboard with three views. The owner sees progress on company goals, managers drill into their projects, and practitioners see how their own work moves the number. Same data, different altitude. At a 30 person company this can be one shared sheet.
- Pay for shared outcomes, with guardrails. London Business School's Rebecca Homkes points out that people follow the money, so pay has to reward collaboration, not just a department's own commitments (LBS). Pair metrics that pull against each other, such as growth and customer satisfaction. Single numbers get gamed, as we showed in Pay for Rat Tails, Get Rat Farms.
- Let teams keep part of what they don't spend, and review every quarter. The one federal agency allowed to roll unused IT money forward showed no year end spike and no drop in quality (Harvard Kennedy School).
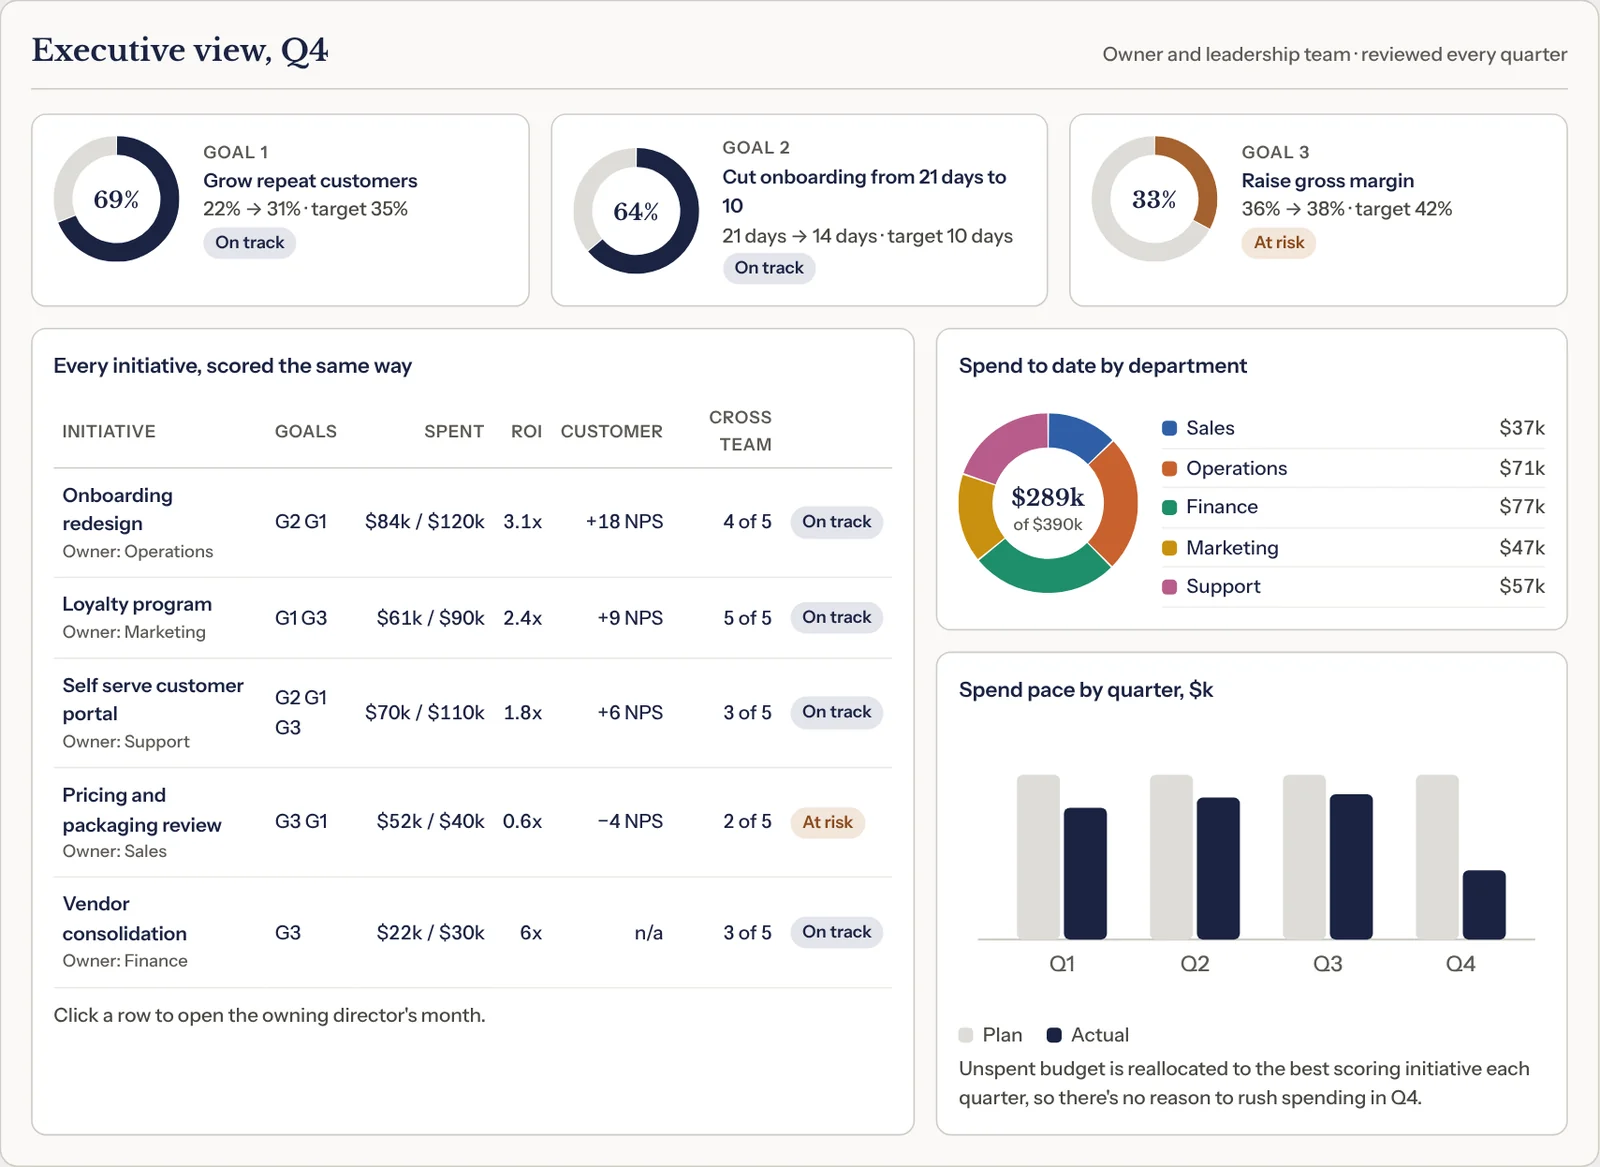
Fund outcomes, measure them one way, and the year end spending spree has nothing left to feed on.
Read the full article
What is use it or lose it budgeting?
Use it or lose it budgeting is any system where money not spent by the end of the fiscal year expires and often lowers next year's allocation. It gives managers a reason to spend late in the year even when the spending adds little value. Liebman and Mahoney found the federal surge was broad based, appearing in nearly all major spending categories, and that spending on 686 major IT projects worth about $130 billion spiked as well (Harvard Kennedy School). Canada sees the same pattern at its March 31 year end, often called March Madness (Chicago Policy Review).
Is alignment the same as execution?
No. Sull, Homkes and Sull found that most companies already cascade goals down the hierarchy reasonably well. Execution breaks in coordination across departments, where commitments from colleagues in other units are not much more reliable than those from outside partners (Graphite summary of the HBR study). A London Business School survey of 11,000 managers found only about a third could list their firm's top three priorities (LBS).
Where does the plan on a page come from?
The interactive plan borrows from three established ideas. Hoshin Kanri's X matrix maps objectives, annual goals, improvement projects, metrics and owners on one page (KaiNexus). Robert Kaplan and David Norton's strategy maps draw the links between objectives as cause and effect, so each link is a hypothesis you can test (Wikipedia). And Ben Shneiderman's rule for information displays, overview first, then zoom and filter, then details on demand, sets the order you click through it (Recorded Future).
FAQ
Should bonuses be tied to company goals?
Yes, but never to a single number. Tie a meaningful share of pay to shared company outcomes, pair each metric with one that pulls against it, and reward outcomes such as customer retention rather than activity such as calls made.
How many company goals should a business set?
Three to five for the year, with quarterly targets under each. More than that and people stop being able to name them, and they can't act on priorities they can't name.
How often should the plan be reviewed?
Every quarter. Annual targets go stale as markets change, and a quarterly review is the point where unspent money can move to the projects that are working instead of being spent in a rush in the last week.
Does this work for a small business?
Yes. A 10 to 200 person company doesn't need a software rollout. It needs a short list of goals, one shared sheet with the same columns for every project, and a monthly or quarterly review where each owner reports against it.
- Jeffrey B. Liebman and Neale Mahoney, Do Expiring Budgets Lead to Wasteful Year End Spending? NBER Working Paper 19481; American Economic Review (2017)
- NBER Digest, Use It or Lose It Budget Rules (March 2014)
- Harvard Kennedy School, faculty working paper version of Liebman and Mahoney (2013)
- Chicago Policy Review, Expiring Budgets and Spending Sprees
- Becker's Hospital Review, 5 misconceptions on strategy execution exposed, summarizing Sull, Homkes and Sull, Harvard Business Review (2015)
- IBM Center for The Business of Government, on Sull, Homkes and Sull (2015)
- Graphite, Why strategy execution fails: some unsettling insights
- London Business School, Two thirds of senior managers can't name their firm's top priorities
- KaiNexus, Common questions about the Hoshin Kanri X matrix
- Wikipedia, Strategy map (Kaplan and Norton)
- Recorded Future, on Shneiderman's information seeking mantra (1996)