
Insights · Method
How Data Spotted a Triple Crown Winner That Horse Racing Experts Passed On
A data analyst found a Triple Crown winner by ruling out everything else. Our own contact form test showed why the audience gets the last word.
Experienced people trust experience, and most of the time that works. The people who buy racehorses are some of the best judges of animals on earth. For generations they paid millions for famous bloodlines, and one of them nearly let a Triple Crown winner walk out of a sale ring for $300,000.
What he needed was not a sharper gut. It was a habit of being wrong cheaply, on purpose, and keeping score.
What did one analyst see in Hip 85 that the room missed?
In August 2013, a bay colt entered the Fasig Tipton yearling sale at Saratoga as Hip 85. He was bred and owned by Ahmed Zayat. Zayat's adviser, Jeff Seder, who holds a Harvard MBA and law degree and runs a horse selection firm called EQB, had told him to keep the colt. Bidding stalled and the colt missed his reserve, so Zayat bought him back through an agent at the posted minimum of $300,000. Auction rules would not let him simply pull the horse (Squash Magazine, Have Heart, Wikipedia).
On the usual measures, the colt was ordinary. Seder's measurements said otherwise.
| Measure | Hip 85 percentile |
|---|---|
| Height | 56th |
| Weight | 61st |
| Pedigree | 70th |
| Left ventricle | 99.61st |
Those figures come from a Squash Magazine profile of Seder. Two years later, that colt, now named American Pharoah, won the Kentucky Derby, the Preakness and the Belmont, the first Triple Crown in 37 years.
Why trust a heart? Because he had thrown out everything else.
Seder's whole approach was to let data drive the insight instead of tradition. He did not ask what buyers believed made a champion. He asked what could be measured, and he let the numbers decide. He emphasizes physical data over race results, and argues that rivals who lean on race times alone are cutting corners (Inverse).
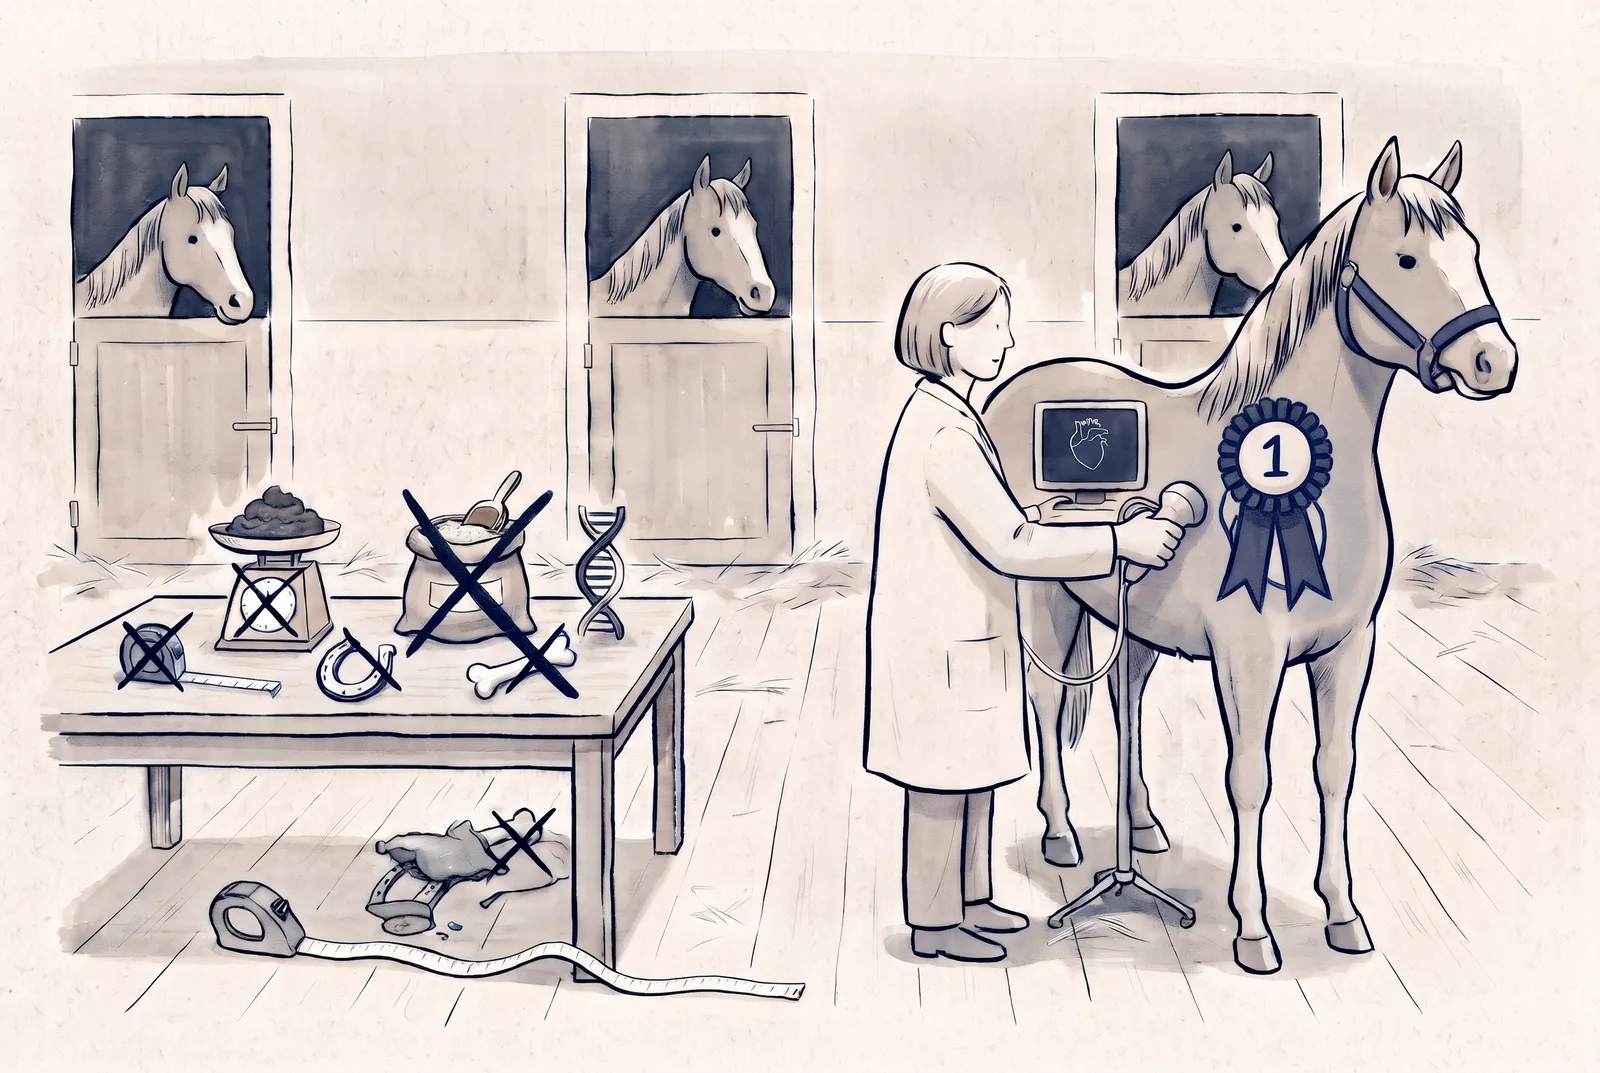
So he did not start with the heart. He started where everyone starts, with pedigree, and found it related to racing success only weakly. Then he went looking for something better, and most of what he tried failed. Nostril size told him nothing. Leg muscle size told him nothing. Manure size told him nothing. Fast times in short workouts rewarded sprinters, even though the big races run three quarters of a mile or longer. His own conference slides add stride length, a so called health gene, herd dynamics, cow bones, horseshoes and a "magic feed" to the pile of ideas that did not hold up (Squash Magazine, Have Heart, Inverse, Seder's HorseTech slides).
Each failure did real work. It removed a competing explanation, so by the time the left ventricle stood out it had survived against everything that did not. The existing data could not answer his question, so he built a portable ultrasound and created his own dataset, scanning tens of thousands of animals over decades.
What turns a hunch into data science?
Four habits, and they apply well beyond horses. These are the principles from his published slides and interviews. His actual model is proprietary, so I cannot tell you more than the sources do.
- Compare fairly. A big horse has a big heart. He ranked each heart as a percentile within horses of the same sex, height and weight, so the measure rewarded the heart and not the size.
- Measure cleanly. His slides stress that technicians needed years of training, because a small error in probe angle produces a large error in the data.
- Use enough data. The slides describe 5,431 yearlings and 2,003 two year olds, more than 7,400 horses, so that luck stops being a good explanation.
- Distrust your best result. When Seder saw a huge left ventricle at Saratoga, he knew some horses have enlarged hearts from disease. The finding had to survive his own suspicion first.
I did a small version of this with a contact form
Twenty plus years of experience told me a longer contact form means fewer submissions. The industry agrees: CXL's review of form tests calls cutting fields a best practice and reports one test where going from nine fields to six dropped conversions 14%.
Because I believe in testing and learning, we created an A/B test. Half of the visitors saw a short form with only the basics: name, email, zip code and a comments box that was not required. The other half saw a longer form with five additional fields, including drop downs specific to the client, their services and what customers would be contacting them about.
Visitors who saw the long form submitted it 60% more often than visitors who saw the short form. Of those people, 33% followed through on the lead and converted.
The reason, in our read, was the audience. Our target segment was older adults, and for them a longer form signaled that the organization was truly interested in them. That is an explanation the test suggests but did not prove.
What does this change about how you use data?
It changes who gets the last word. Seder compared each heart to its own size group because the overall average hid the answer. The same idea applies to your customers. Regardless of what the data says holistically, keep your target audience in mind, because a result that holds for everyone can be wrong for the people you serve. I made the same argument about product design in the OXO peeler post: design for your hardest customer, not the average one.
It is also the reason to test every time, even when you feel sure. Nobody would have guessed that two free punches on a car wash loyalty card would change much, since customers still had to buy the same eight washes. In a study of about 300 cards over nine months, 34% of customers with the head start card earned the free wash, against 19% with a blank card. That study was not ours, but you can read all about it in the car wash loyalty post. The lesson is the same as the horse and the form: your gut can only suggest, and the test is what tells you.
Experience tells you where to look. Data tells you whether you were right. Your audience tells you how to read it.
Read the full article
What is the full trial and error record?
Here is every dead end I could confirm, with where it came from.
| What was tried | What happened | Source |
|---|---|---|
| Pedigree | Correlated with racing success, but weakly | Squash Magazine |
| Nostril size | No useful correlation | Squash Magazine |
| Leg muscle size | No useful correlation | Squash Magazine |
| Manure size | No useful correlation | Squash Magazine |
| Fastest time in short workouts | Rewards sprinters, but elite races run three quarters of a mile or longer | Inverse |
| Stride length, health gene, herd dynamics, feed, horseshoes, cow bones | Dismissed as single variable fixes | Seder's HorseTech slides |
| Left ventricle | A massive correlation with racing performance | Squash Magazine |
| Spleen size, gait, wheezing after a short run | Also mattered, though the left ventricle was the key | Squash Magazine |
The slides are Seder's own account, and some are images I could not read, so treat that part of the list as his version of events.
What was the sprint time trap?
Inverse reports Seder's argument that buyers favor horses that win short trials of about an eighth of a mile, while elite races are three quarters of a mile or longer. He compares it to picking an 800 meter team from 100 meter results. In data terms, the buyers were measuring something easy to see instead of something that predicts the outcome they care about (Inverse).
Is prediction the same as explanation?
No. A reviewer of the book Everybody Lies made a fair point about this story: Seder's model predicts, but it does not explain why a big left ventricle wins races, and a prediction should be tested outside the data it was built on (Michael Bass). The sources also describe his findings only as correlations and never publish his model or coefficients. That is why the failed experiments matter. They are the evidence that he was testing, not telling a story after the fact.
How much of the story is Seder's own account?
Quite a lot. Seder told the American Bar Association's journal that about 90 percent of top pedigree horses that cost $1 million at auction are no good, and that American Pharoah's pedigree alone gave him about a 10 percent chance (ABA Journal). That is the claim of the man selling the method. Wikipedia's account adds that Zayat had pledged not to sell the colt for less than $1 million and that the sales team at Taylor Made saw live bidding over $200,000 before the reserve was missed. Both versions can be true. One horse proves nothing, and the lesson is the method.
What did the contact form test show in more detail?
The assumption was reasonable. CXL reports that changing only the label copy on a nine field form lifted conversions 19.2%, which shows how much small choices matter. Everything in my experience said shorter wins.
The test split visitors evenly. The short form asked for name, email, zip code and an optional comments box, and the long form added five fields with drop downs specific to the client. The long form drew 60% more submissions than the short form, and 33% of those submitters followed through on the lead and converted. A long form told older adults that someone wanted to understand their situation before the first call. A short form can read as a funnel.
The broader data would have told me to shorten the form. The audience told me not to. This is the same logic as the OXO Good Grips peeler, which was shaped by testing with people with arthritis. And when a test surprises you, treat it as the start of the next one: Bayesian thinking says every result, even a surprising one, should make your next test smarter.
What can you do this week?
- Write your assumption down before you test it, so you cannot quietly adjust it afterward.
- Expect most ideas to fail and test the cheap ones first.
- Compare against a fair baseline, the way Seder compared hearts within a horse's own size group.
- Check how clean your measurement is before you trust the number.
- Distrust your best result before you act on it.
- Ask who the audience is before you trust the average.
- Say plainly what the data cannot explain.
FAQ
Who is Jeff Seder?
Jeff Seder holds a Harvard MBA and law degree and runs EQB, a horse selection firm that uses physiological data to evaluate horses. He advised Ahmed Zayat on American Pharoah in 2013.
Why did Ahmed Zayat buy back his own colt?
The colt did not reach his reserve at the 2013 Saratoga sale, and Zayat, through an agent, bought him back at the posted minimum of $300,000. Seder had urged him to keep the horse.
What did the left ventricle have to do with American Pharoah?
Seder found that left ventricle size, ranked against horses of the same sex, height and weight, correlated strongly with racing performance. The colt's left ventricle ranked in the 99.61st percentile.
Did the longer contact form really win?
For our audience, yes. Visitors who saw the long form submitted it 60% more often than visitors who saw the short form, and 33% of those submitters followed through on the lead and converted. Our read is that the audience, older adults, took a longer form as a sign of real interest. The test did not prove that reason.
Why should I A/B test when I am sure of the answer?
Because confidence is not evidence. We expected a longer form to hurt submissions, and it drew 60% more. In a separate study of about 300 car wash loyalty cards, 34% of customers with a head start card earned the free wash against 19% with a blank card.
How do I use data without ignoring my audience?
Start by asking who the result is for. A result that holds across everyone can still be wrong for your target segment, so test with the people you serve and read the data through their eyes.