
Insights · Customer Experience
Customer Journey Map Stages: What a 12 Foot Map Taught an Automotive Brand
Why the whole journey matters more than any one department's piece of it.
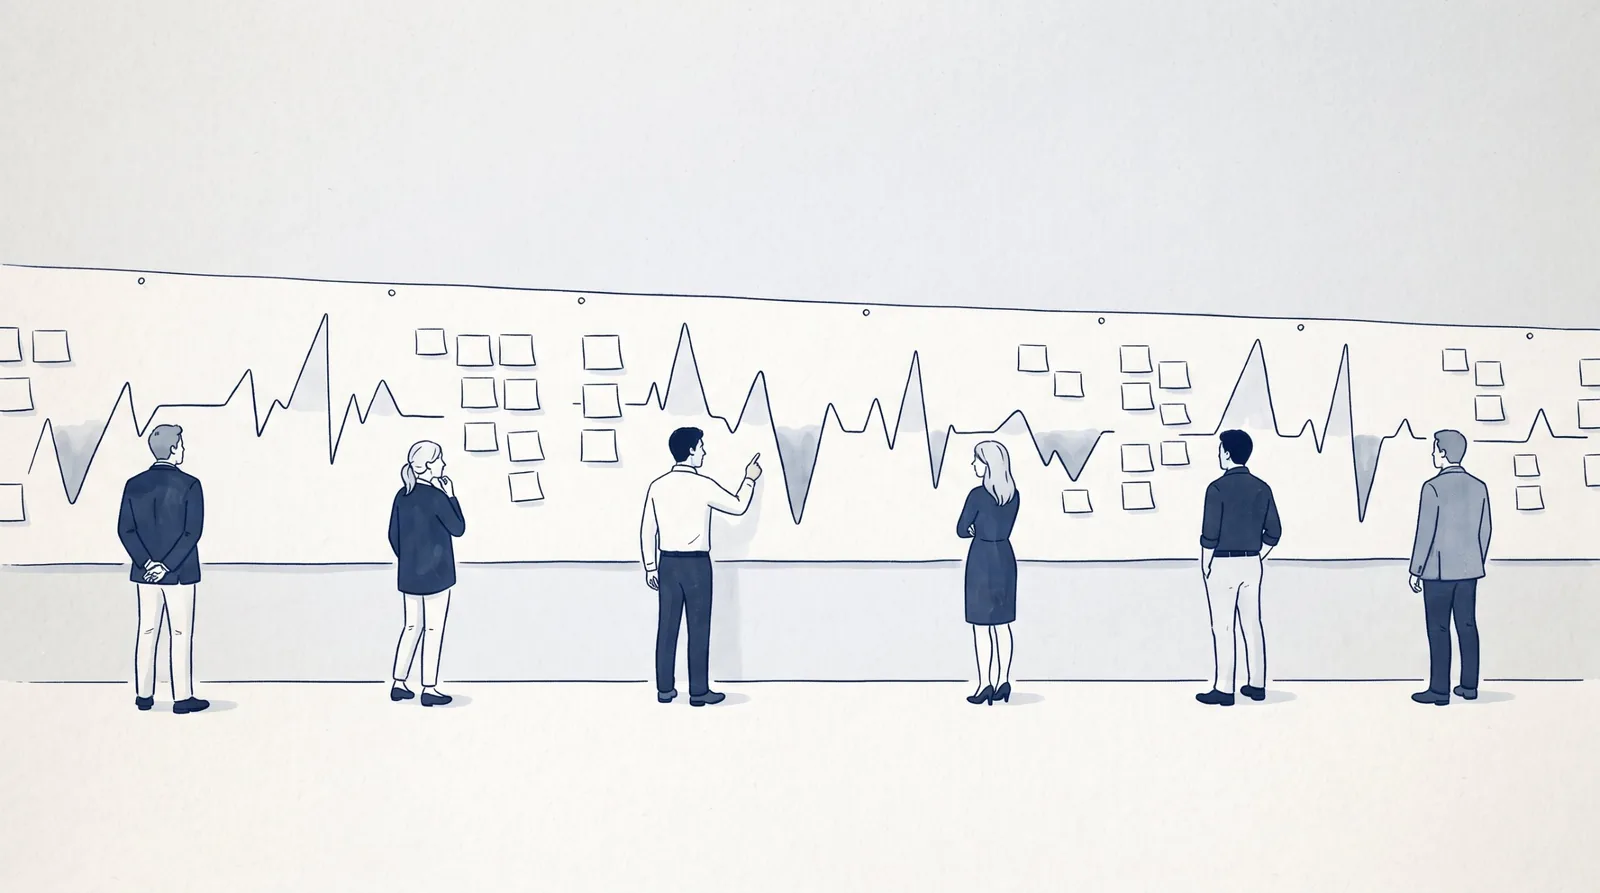
Picture a company where every department scores 95% customer satisfaction. Marketing, the website, the showroom, finance, the service desk. Every dashboard is green.
Now follow one customer through six of those moments. McKinsey ran this math: at 95% per interaction across six interactions, up to one in four customers still has a poor experience somewhere along the way. Every team hit its number, and a quarter of your customers walk away with a story you would not want told.
That gap between departments is where a customer journey map earns its keep. I helped build one for an automotive brand. By the time we finished, it ran 12 feet along the wall.
What are the stages of a customer journey map?
The names vary from model to model. The questions don't.
- Awareness. What first put you in front of them?
- Consideration. Why did they keep you on the list, or cross you off?
- Purchase. How much friction sits between "I want it" and "it's mine"?
- Service. Does owning it live up to what you promised?
- Repurchase. What made coming back the easy choice?
- Brand ambassador. What did you give them to tell other people?
This is not a funnel that ends at the sale. Service is not the end of the sales story. It is the start of the next one.
Why map the whole journey instead of each touchpoint?
In today's world, the journey is no longer linear, and it is no longer predictable. A customer can first meet your brand through a friend, a review site, a social feed, an AI assistant or your own showroom, then move back and forth between them before deciding. In Cox Automotive's 2025 study of recent car buyers, 75% used a third party research site such as Kelley Blue Book, and a quarter used an AI tool somewhere along the way. You can't plan for one path, so you have to look at the journey as a whole.
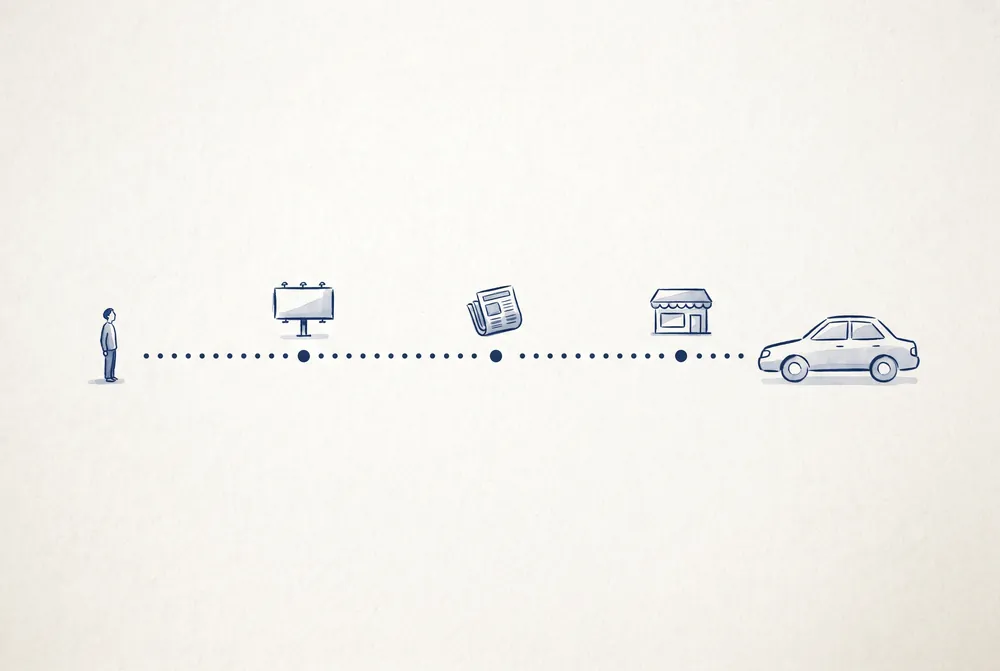 Then
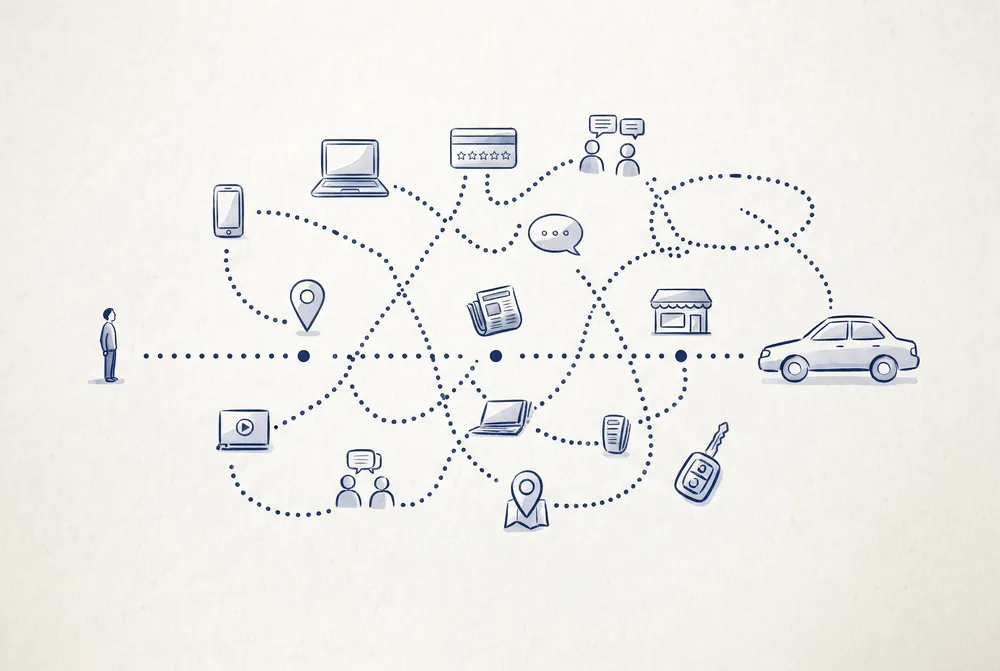 Now
Customers judge the trip, not the stops. In a survey of about 27,000 American consumers across 14 industries, McKinsey found that satisfaction with the whole journey was 30% more predictive of overall satisfaction than satisfaction with each interaction. The same research found one bad experience carries four to five times the weight of a good one.
The catch is that a journey crosses departments, and most companies are organized by department. Marketing owns awareness, sales owns the purchase, service owns the repair. Nobody owns the handoffs. McKinsey's advice was to build teams that own the journey end to end, across functions.
| Finding | Number | Source |
|---|---|---|
| Customers with a poor experience when each of six steps scores 95% | Up to 1 in 4 | McKinsey, 2014 |
| How much better journey satisfaction predicts overall satisfaction | 30% more predictive | McKinsey, 2014 |
| Weight of one negative experience versus one positive | 4 to 5 times | McKinsey, 2014 |
| Car buyers whose ideal purchase mixes online and in person steps | 63% | Cox Automotive, 2025 study |
| Customer service issues fully resolved in self service | 14% | Gartner, 2024 |
| Owners who service at the dealership and say they'll likely buy their next car there | 74% | Cox Automotive, 2025 study |
When I put this to work
For an automotive brand, I helped build a customer journey map that covered the whole life of a car: shopping for it, buying it, owning it, servicing it and coming back for the next one. It was a huge undertaking. More than 20 teams and partners had a hand in it, from marketing and the dealer body to parts, learning management, and security and compliance, because the journey crossed every one of them.
We plotted the quantitative and qualitative data behind every positive and negative moment we could find, in person and online. Under each step sat what customers were thinking, the touchpoints they used, the data behind it, and the challenges and opportunities the team saw. Laid out end to end, it showed something no single department's report could.
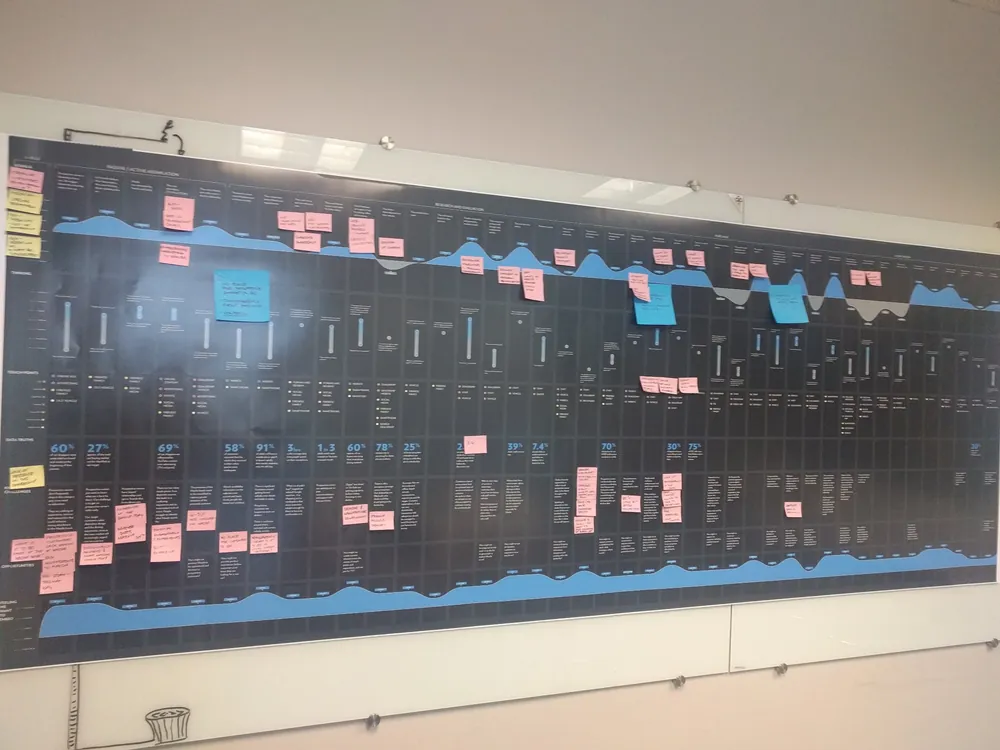
Some in person frustrations had a digital fix. If you've bought a car in the US, you know the list: hours at the dealership, haggling and debating, the feeling you missed out on a better deal, the worry that the dealer will hound you, and a finance process that drags on. Cox Automotive's 2025 research still ranks waiting at the dealership as buyers' top friction point. The digital answers were a more streamlined way to shop and buy, and a better owner app that put connected car features and the owner's financial information in one place.
The lessons didn't stay on the wall. They became an international initiative for the brand. We rolled out an integrated owner app and a more shopper centric website. We set up a feedback loop: a monthly check in with the call center, website analytics, product and marketing teams to talk through the issues customers were raising and what we were seeing on the website and other platforms. And a cross functional team reviewed every feature being built, weighing its business value against its value to the customer, with the customer counting just as much, if not more.
This is the same reason every engagement I run starts with Discovery. The people inside a business are often too close to see the whole line. Putting it on one wall lets everyone see it at once.
How do you build a customer journey map?
- Pick one journey that matters. McKinsey's research suggests three to five journeys usually matter most. Start with one.
- Bring every department that touches it. If they touch the customer, they bring their view.
- Walk it as the customer. Awareness through brand ambassador, online and in person side by side.
- Mark every high and every low. Use real evidence: reviews, call notes, survey comments, analytics, conversations with customers. Weight the lows.
- Ask "person or screen?" for every low. The channel where it broke is not always the channel that fixes it.
- Give every handoff an owner, and build a feedback loop. A monthly check in on what customers are calling about and what your analytics show tells you when the map needs updating.
Your customers don't experience your org chart. They experience the line.
Read the full article
Who had a hand in the map?
A journey that runs from the first ad to the next purchase touches almost every part of a car company. These are the teams and partners that worked on this map:
- Brand and marketing: marketing, creative, CRM and owner loyalty, social media and community, media and advertising agencies, event coordinators.
- Product and digital: R&D, product teams, digital and ecommerce, data analytics and customer insights, IT, back end infrastructure.
- Sales, service and ownership: the dealer body, customer service, parts, accessories, merchandising, lenders.
- Governance and support: security and compliance, legal and privacy, learning management, executive sponsors.
Where does each stage usually break?
Awareness and Consideration. McKinsey's 2009 research found that shoppers don't just narrow a list. During active evaluation they often add brands they hadn't considered at the start. A brand can enter late, and a brand that looked safe can drop out.
Purchase. Car buyers want more online than they get. In Cox Automotive's 2025 Car Buyer Journey Study of 2,344 recent buyers, 48% wanted to apply for credit online but only 33% did, and 40% wanted to choose finance and insurance products online but only 16% did (Cox Automotive). Meanwhile 53% still completed the entire process at the dealership. Every gap between what customers want and what they get is a map finding waiting to happen. Cox Automotive's August 2025 study of what drives car shopping satisfaction, based on 1,090 recent buyers, found idle or waiting time at the dealership was the top friction point, and choosing finance and insurance products ranked among the most stressful steps, with many shoppers feeling overwhelmed and confused (Cox Automotive).
Service. In Cox Automotive's 2025 Service Industry Study, only 54% of owners with cars two years old or newer went back to the selling dealer for service, down from 72% in 2023 (Cox Automotive). Nearly half, 45%, were dissatisfied with dealership service, mostly over unexpected costs and poor communication. Neither of those is a mechanical problem. Both are journey problems.
Repurchase. The same study found that owners who service at the dealership are far more likely, 74%, to buy their next car from that same store. The sale is often won in the service lane, years earlier. For how loyalty programs can help or hurt here, see the car wash experiment.
Brand ambassador. In Nielsen's 2015 survey of more than 30,000 online respondents in 60 countries, 83% said they trust recommendations from friends and family, the most trusted form of advertising in the study. The same share said they act on those recommendations at least some of the time. Your happiest owners are a channel, if the journey gives them something worth repeating.
Is a customer journey map the same as a service blueprint?
No, and the difference matters when several departments are involved. A journey map shows what the customer lives through. A service blueprint, first described by G. Lynn Shostack in Harvard Business Review in 1984, adds what happens behind the scenes to produce each moment. Her "line of visibility" separates what the customer sees from the work they never see.
The map gets everyone to agree on the customer's experience. The blueprint gets everyone to agree on who fixes it. When a low point traces back to a handoff, the fix usually lands somewhere in People, Process or Technology, with Data running through all three.
Digital or human: how do you choose the fix?
Start with what the customer needed in that moment, not with the channel you already own. Gartner's 2024 survey of 5,728 customers found that even issues customers called "very simple" were fully resolved in self service only about a third of the time. A screen is great at status, scheduling and anything the customer would otherwise chase. A person is better when the problem is unusual, emotional or expensive.
The reverse is just as true. Waiting in a lobby, repeating your details to three people, or calling to ask where things stand are in person problems with digital answers.
Questions owners ask about customer journey maps
What are the stages of a customer journey map?
Most maps use six: Awareness, Consideration, Purchase, Service, Repurchase and Brand ambassador (also called advocacy). Some models merge or rename stages, but every version follows the customer from first notice to telling others.
How is a customer journey map different from a sales funnel?
A funnel ends at the sale. A journey map keeps going through ownership, service and the next purchase. McKinsey's consumer decision journey research describes that as a loop, where the experience after purchase shapes the next decision.
Who should be involved in building a customer journey map?
Every department that touches the customer on that journey, plus real customer evidence. A journey crosses departments, so a map built by one team shows only that team's stretch.
How often should you update a customer journey map?
There's no fixed schedule, but a feedback loop helps. A monthly check in between the teams who hear from customers and the teams who watch your website and analytics shows spikes in new issues early. Revisit the map when something changes: a new product, a new channel, a shift in reviews or complaints, or a fix you rolled out and want to check.
Should you fix customer experience problems with technology or with people?
It depends on the moment. Gartner found only 14% of service issues are fully resolved in self service, and most car buyers in Cox Automotive's 2025 study wanted a mix of online and in person steps. Map the low point first, then choose the channel that resolves it.
- Alfonso Pulido, Dorian Stone and John Strevel, The three Cs of customer satisfaction: Consistency, consistency, consistency, McKinsey & Company (March 1, 2014)
- David Court, Dave Elzinga, Susan Mulder and Ole Jørgen Vetvik, The consumer decision journey, McKinsey Quarterly (June 2009)
- Cox Automotive 2025 Car Buyer Journey Study, as reported by Kelley Blue Book, a Cox Automotive company (January 15, 2026)
- Cox Automotive, New Cox Automotive Study Finds Dealerships Have Lost 12% of Service Visits to Competition Since 2018 (November 11, 2025)
- Cox Automotive, Cox Automotive Unveils Key Insights into Successful Car Deals in New Study: Drivers of Car Shopping Satisfaction (August 26, 2025)
- Gartner, Gartner Survey Finds Only 14% of Customer Service Issues Are Fully Resolved in Self-Service (August 19, 2024)
- Nielsen, Global Trust in Advertising (September 2015)
- G. Lynn Shostack, Designing Services That Deliver, Harvard Business Review (January 1984)